Immersein Charts from Web Tables
ChartImmerse is a powerful Chrome extension that seamlessly converts HTML tables from any website into visually stunning charts. Unleash the potential of your data and gain valuable insights with just a few clicks.

Features
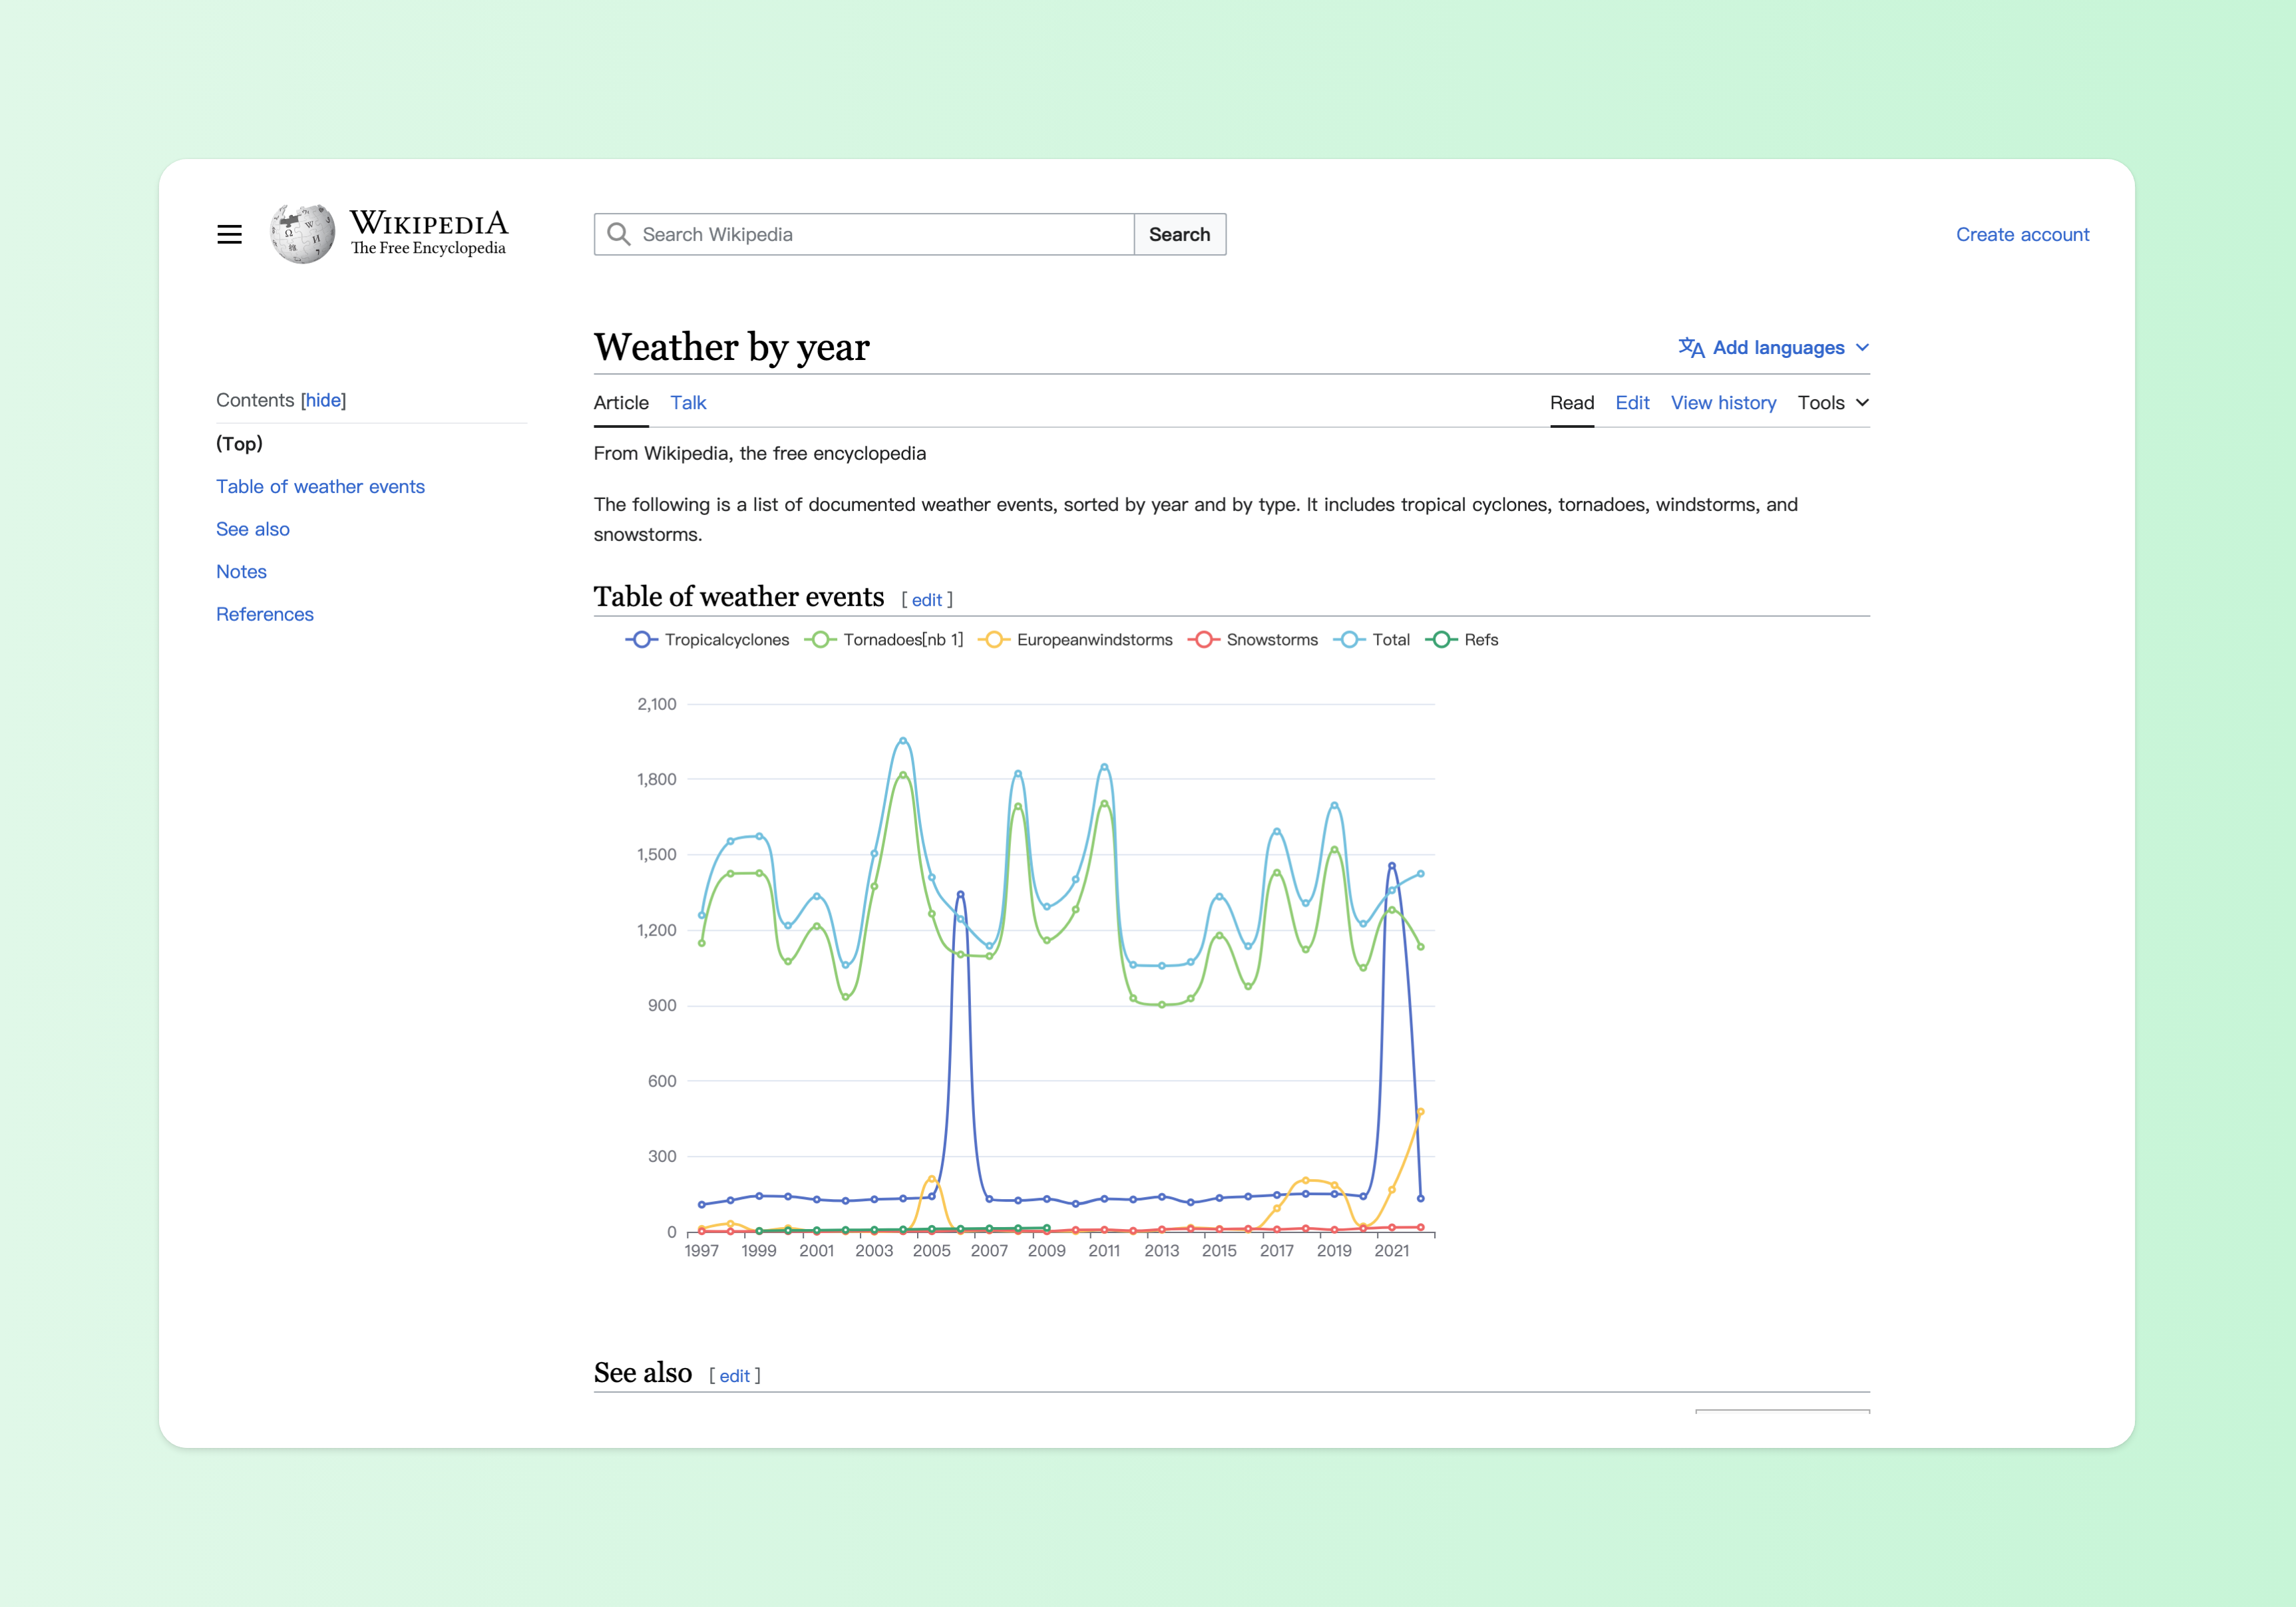
Seamlessly Convert Tables
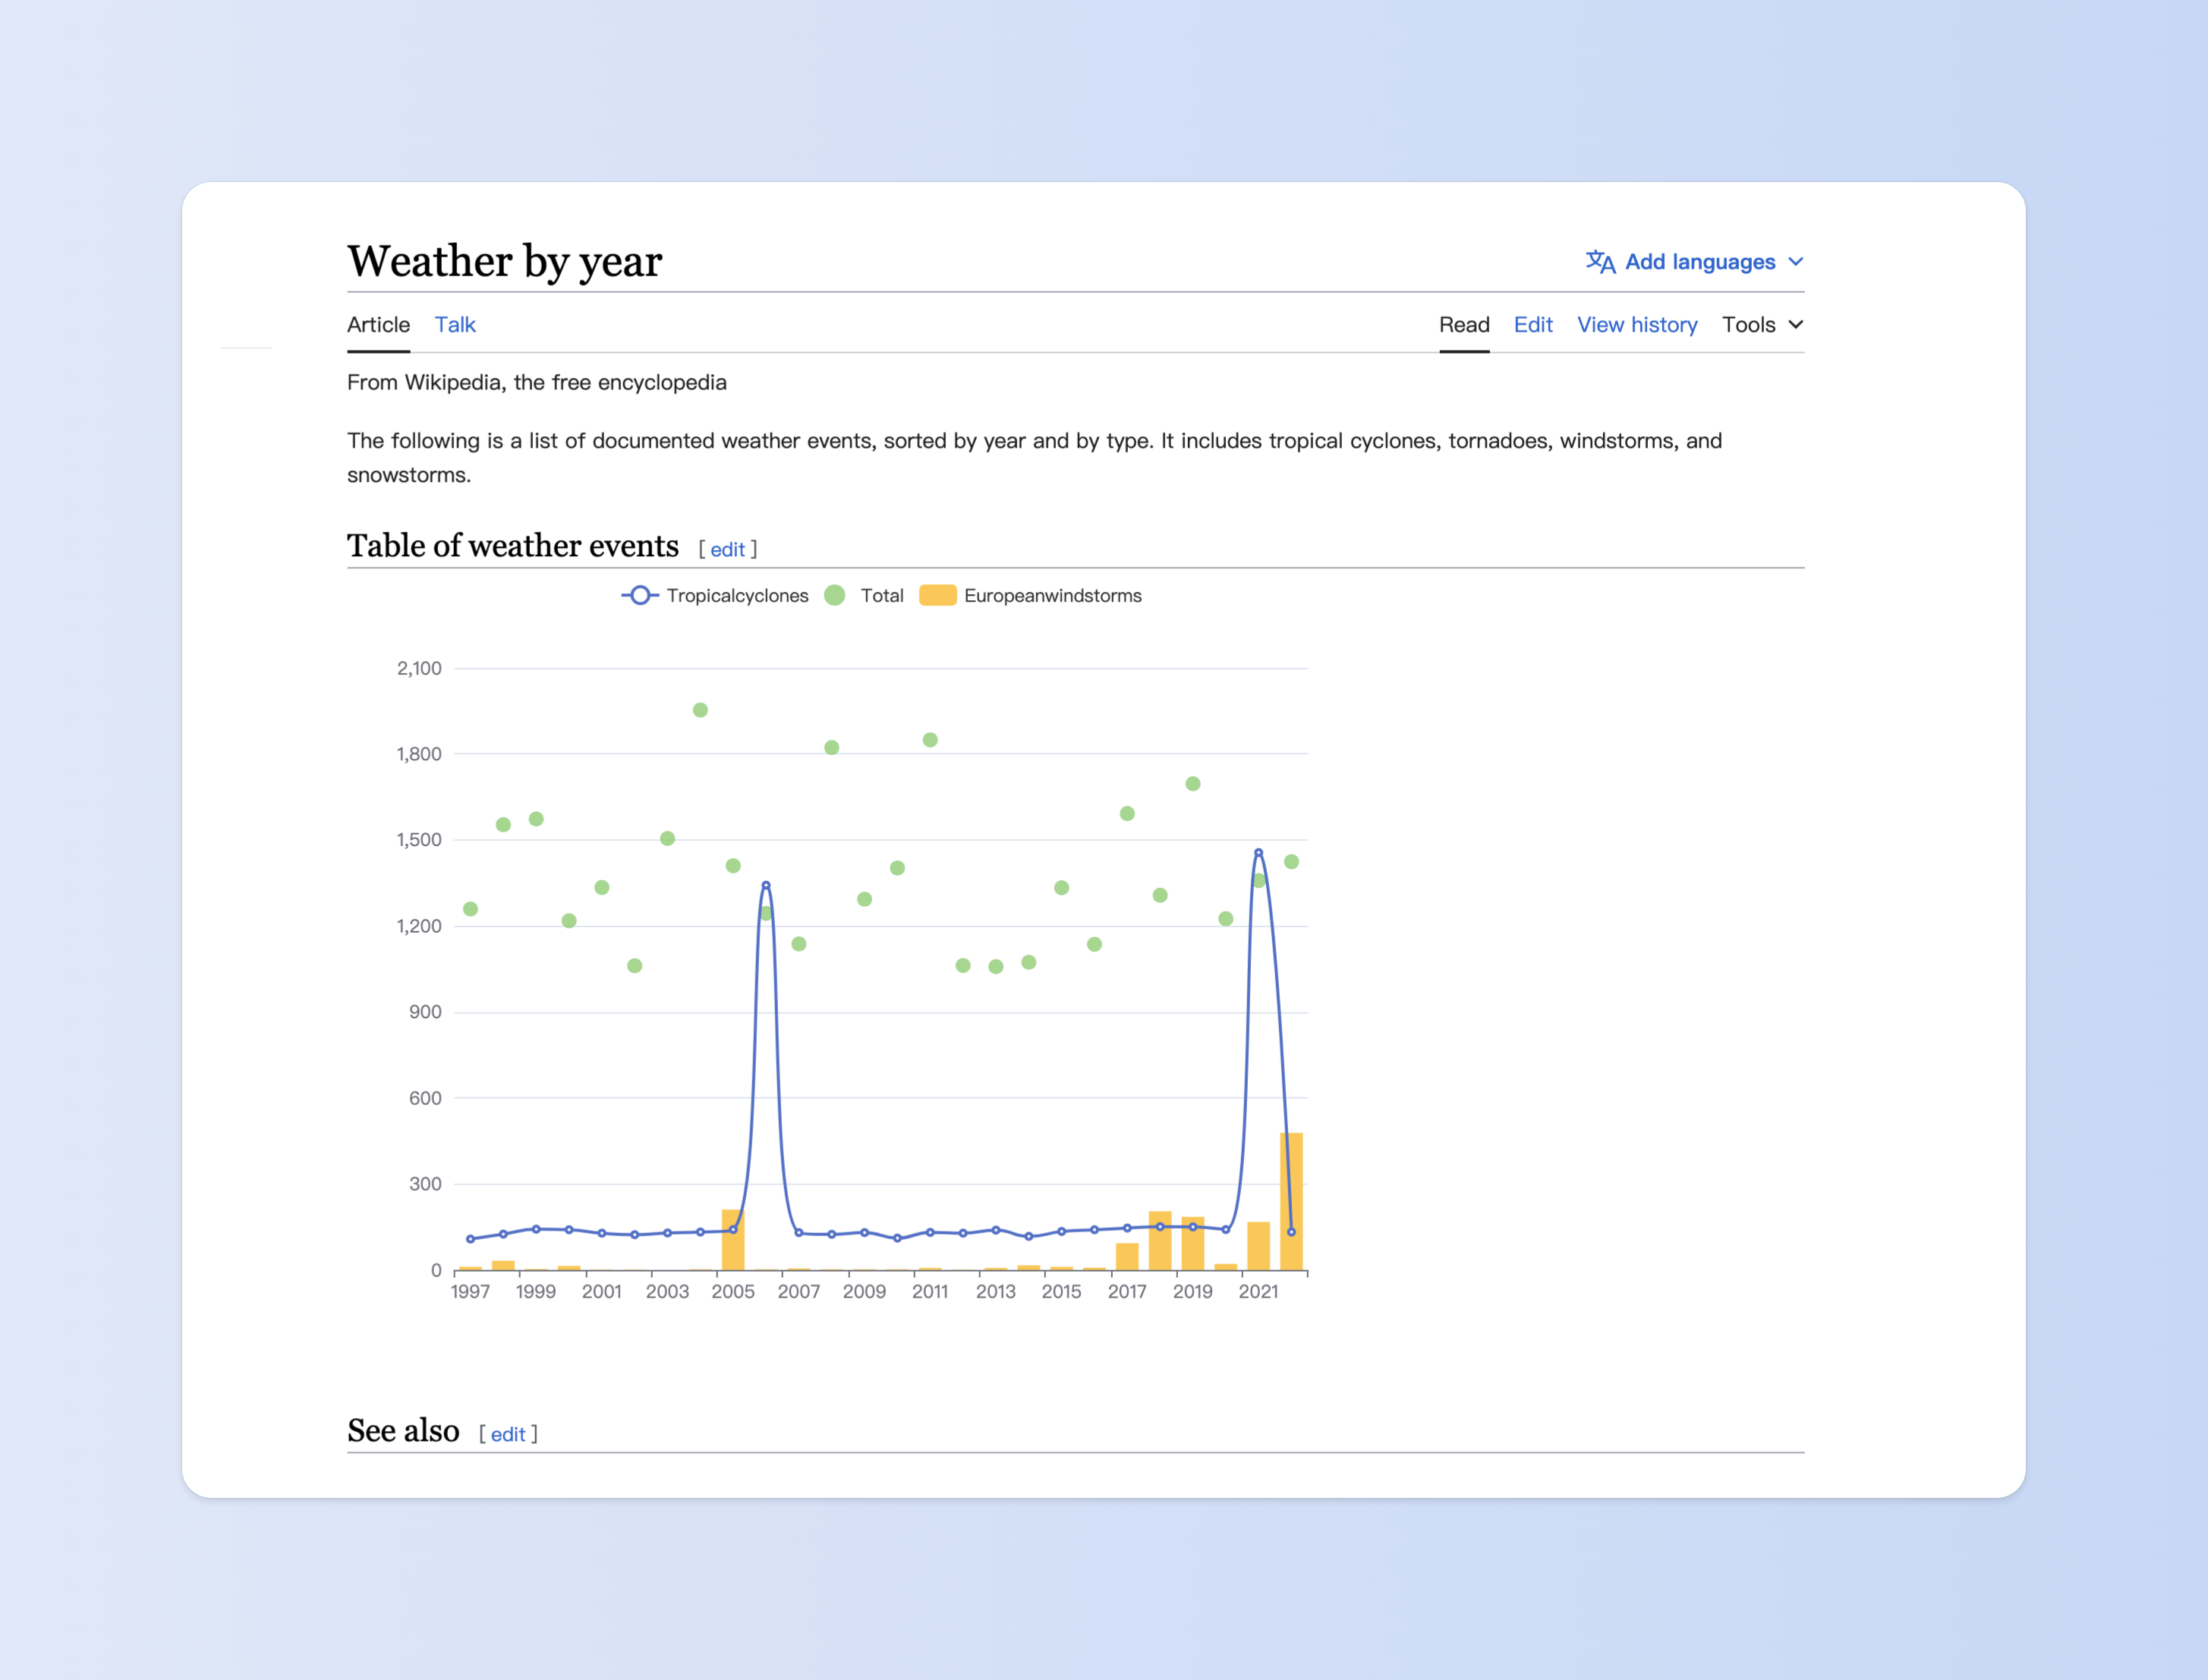
Explore Various Chart Types
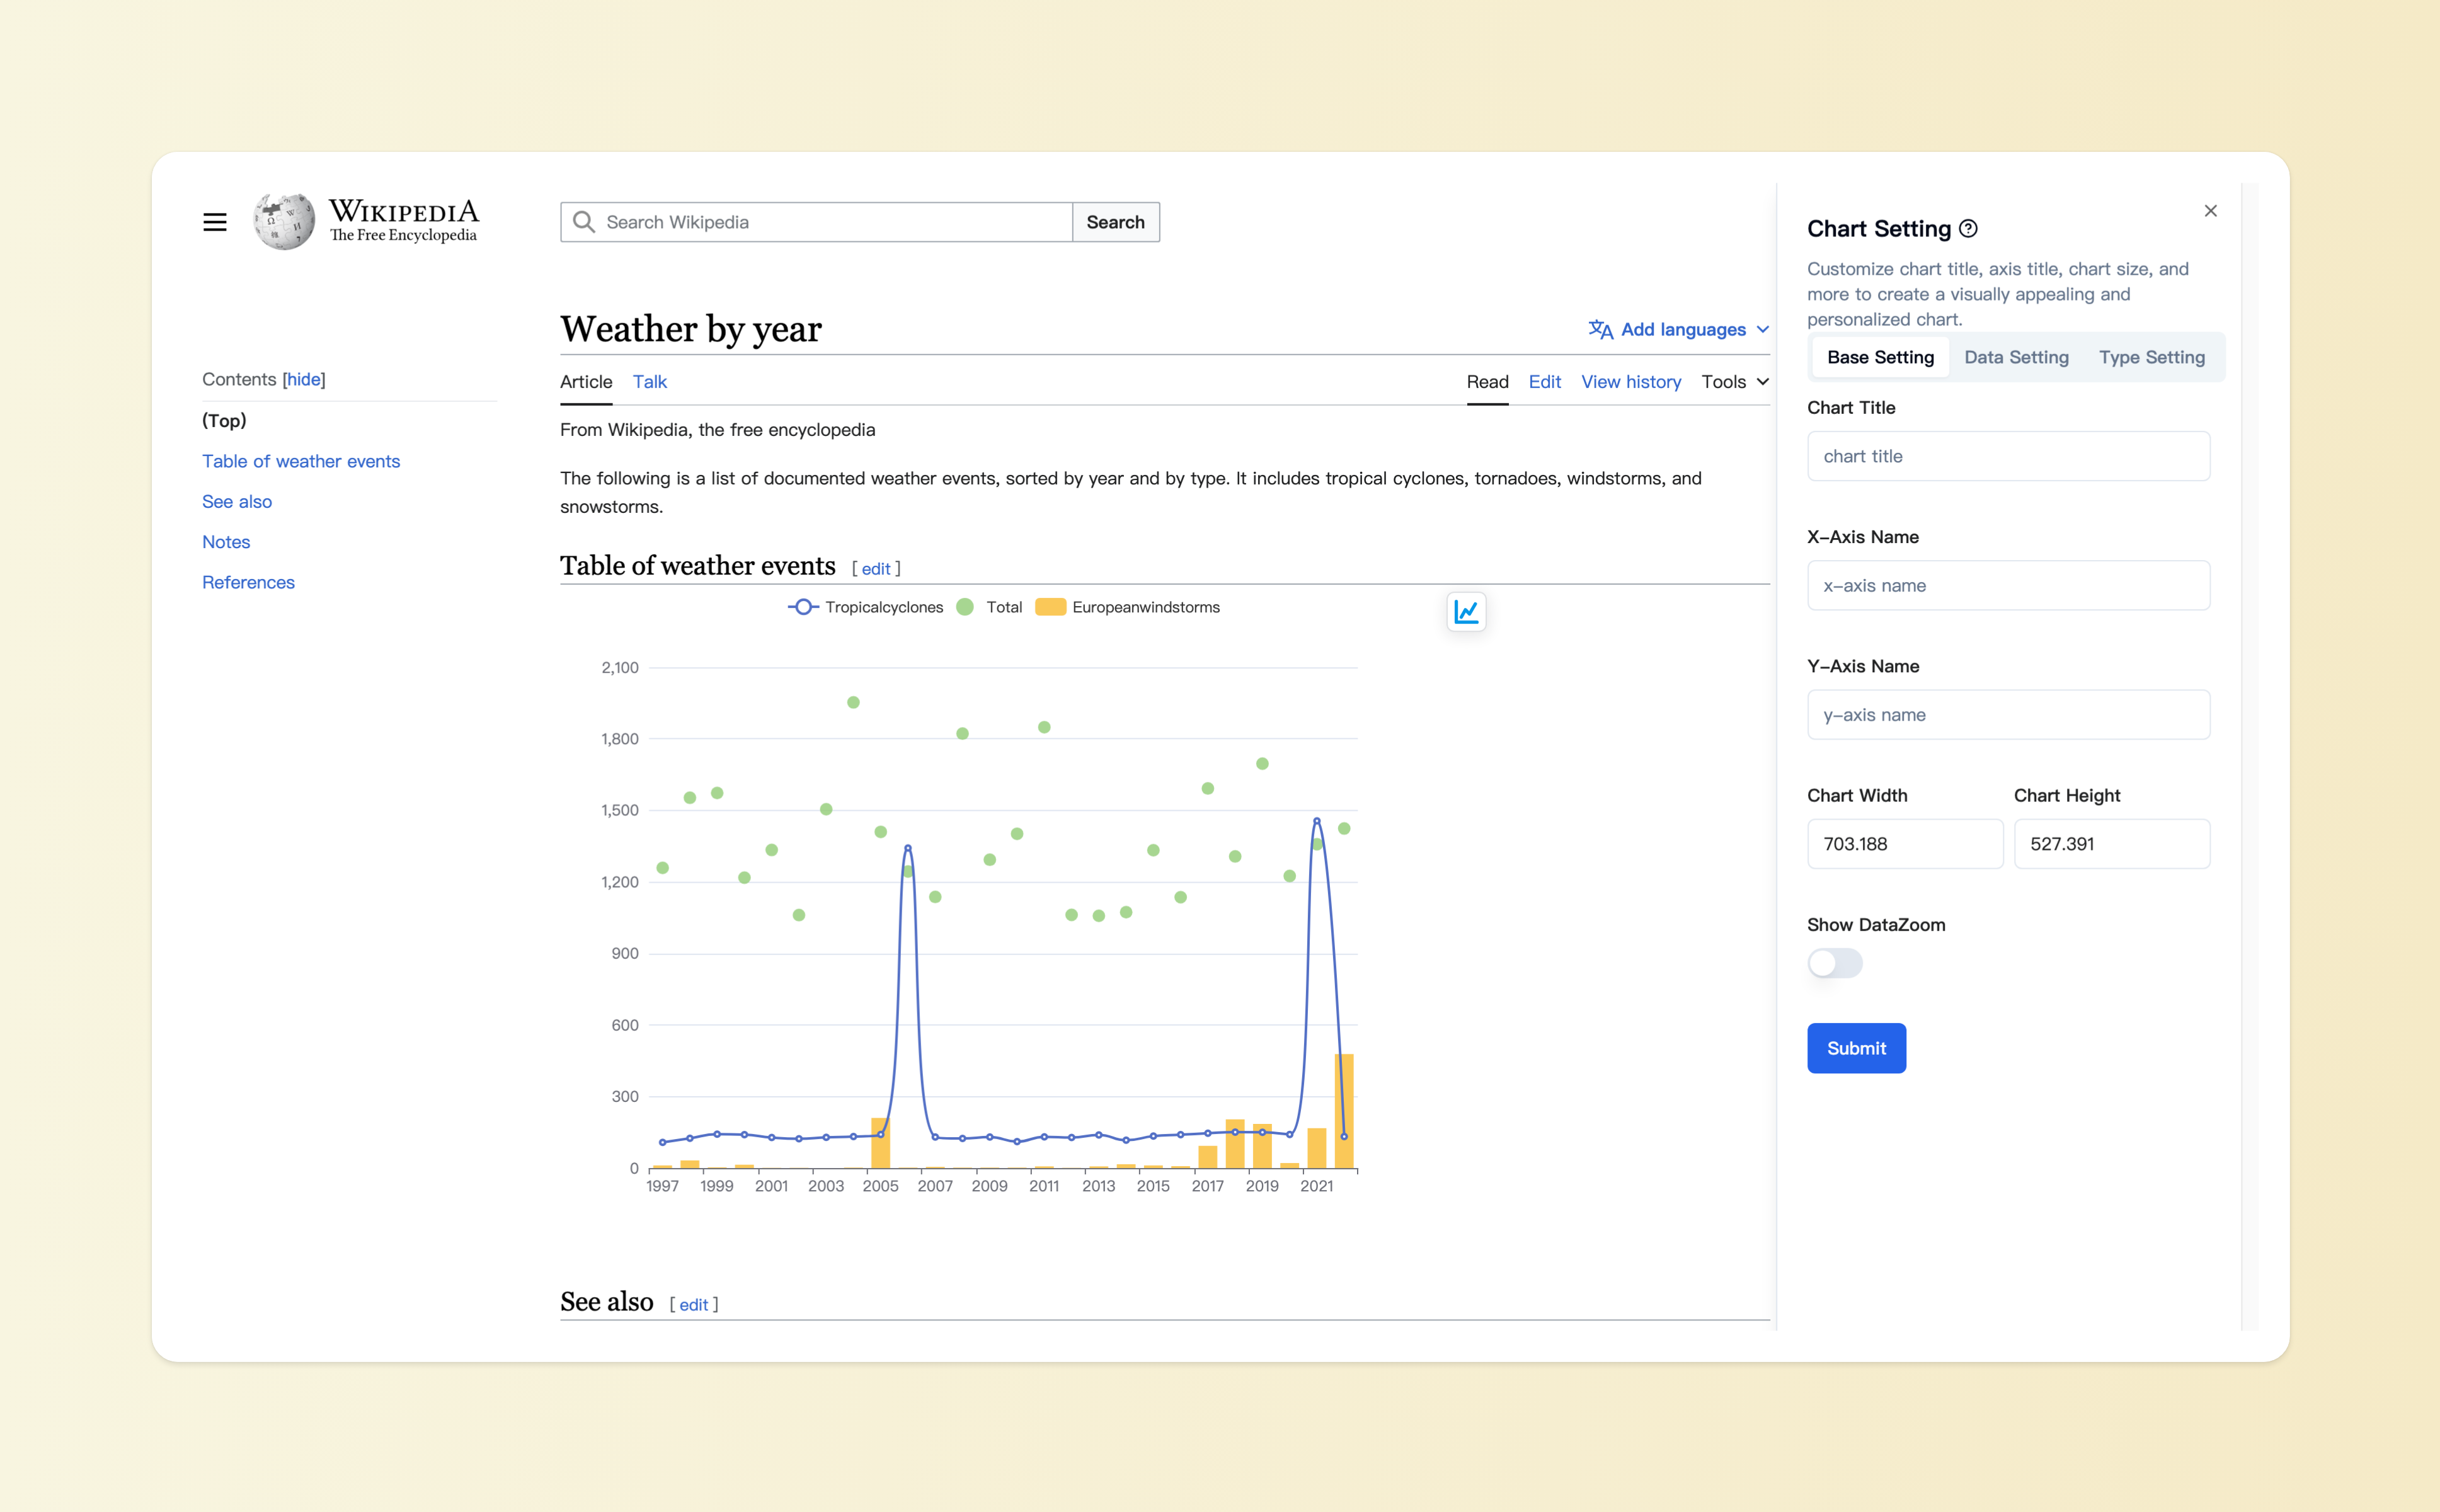
Customize with Ease
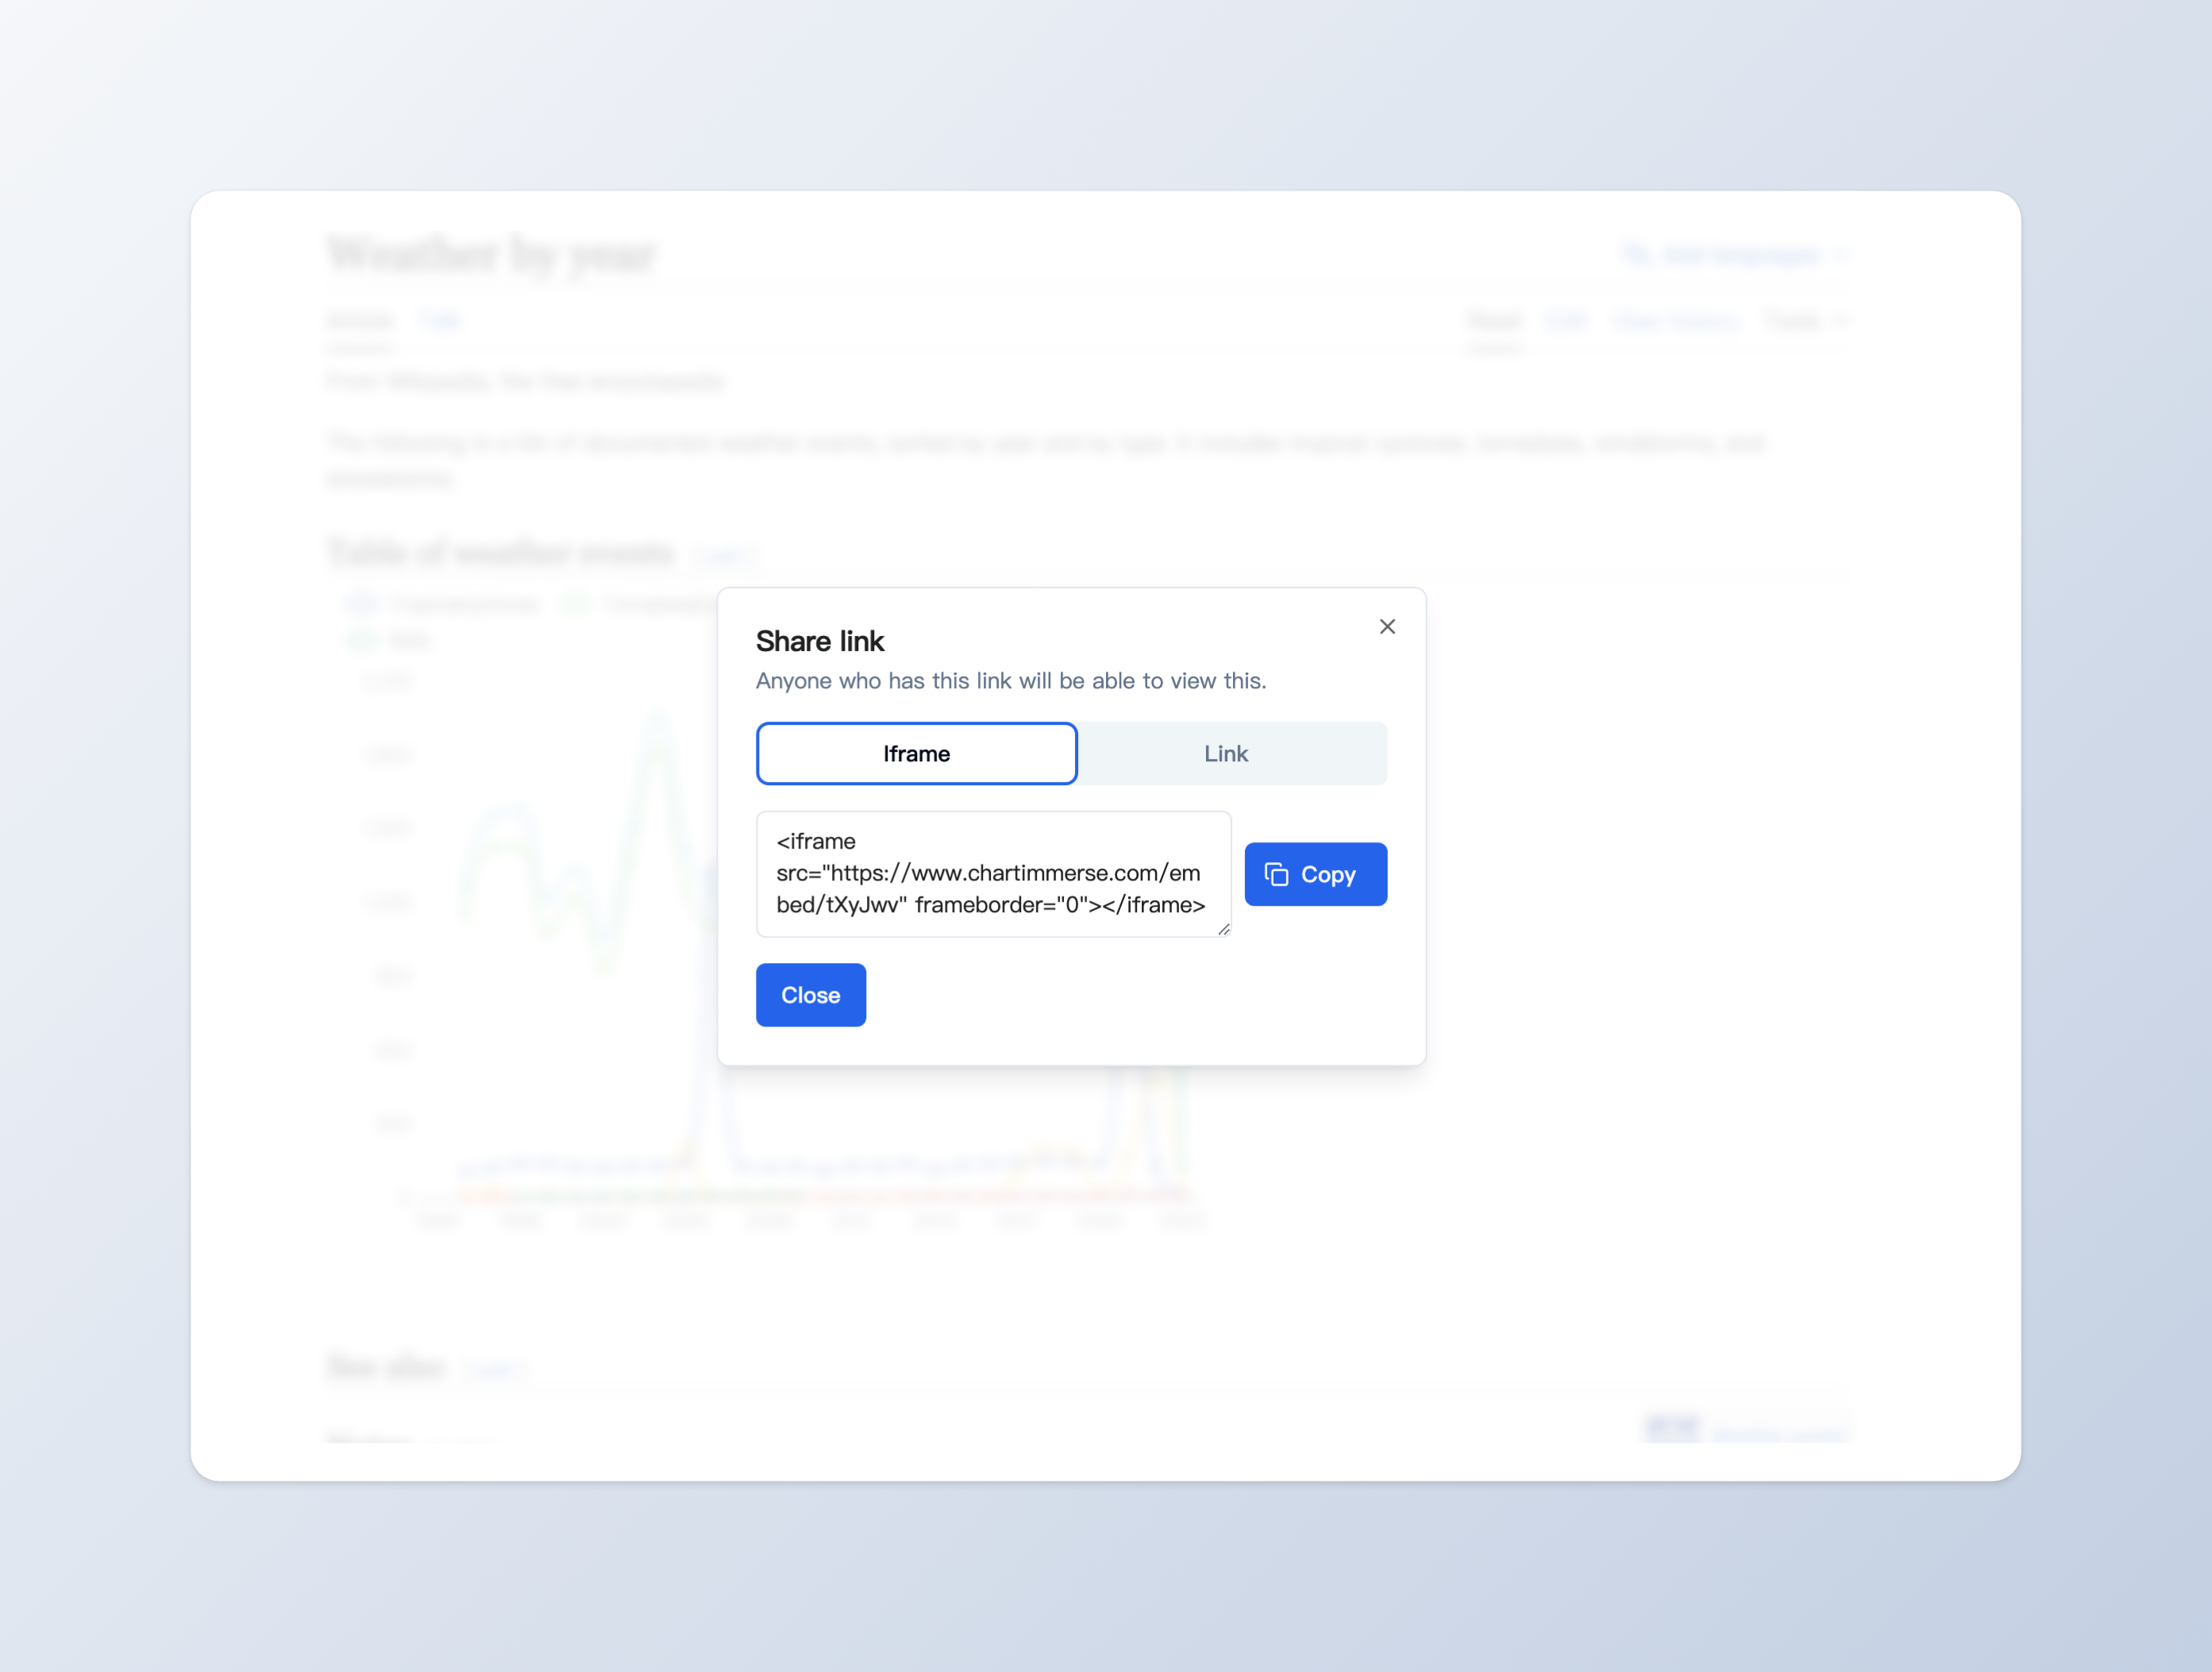
Share and Embed
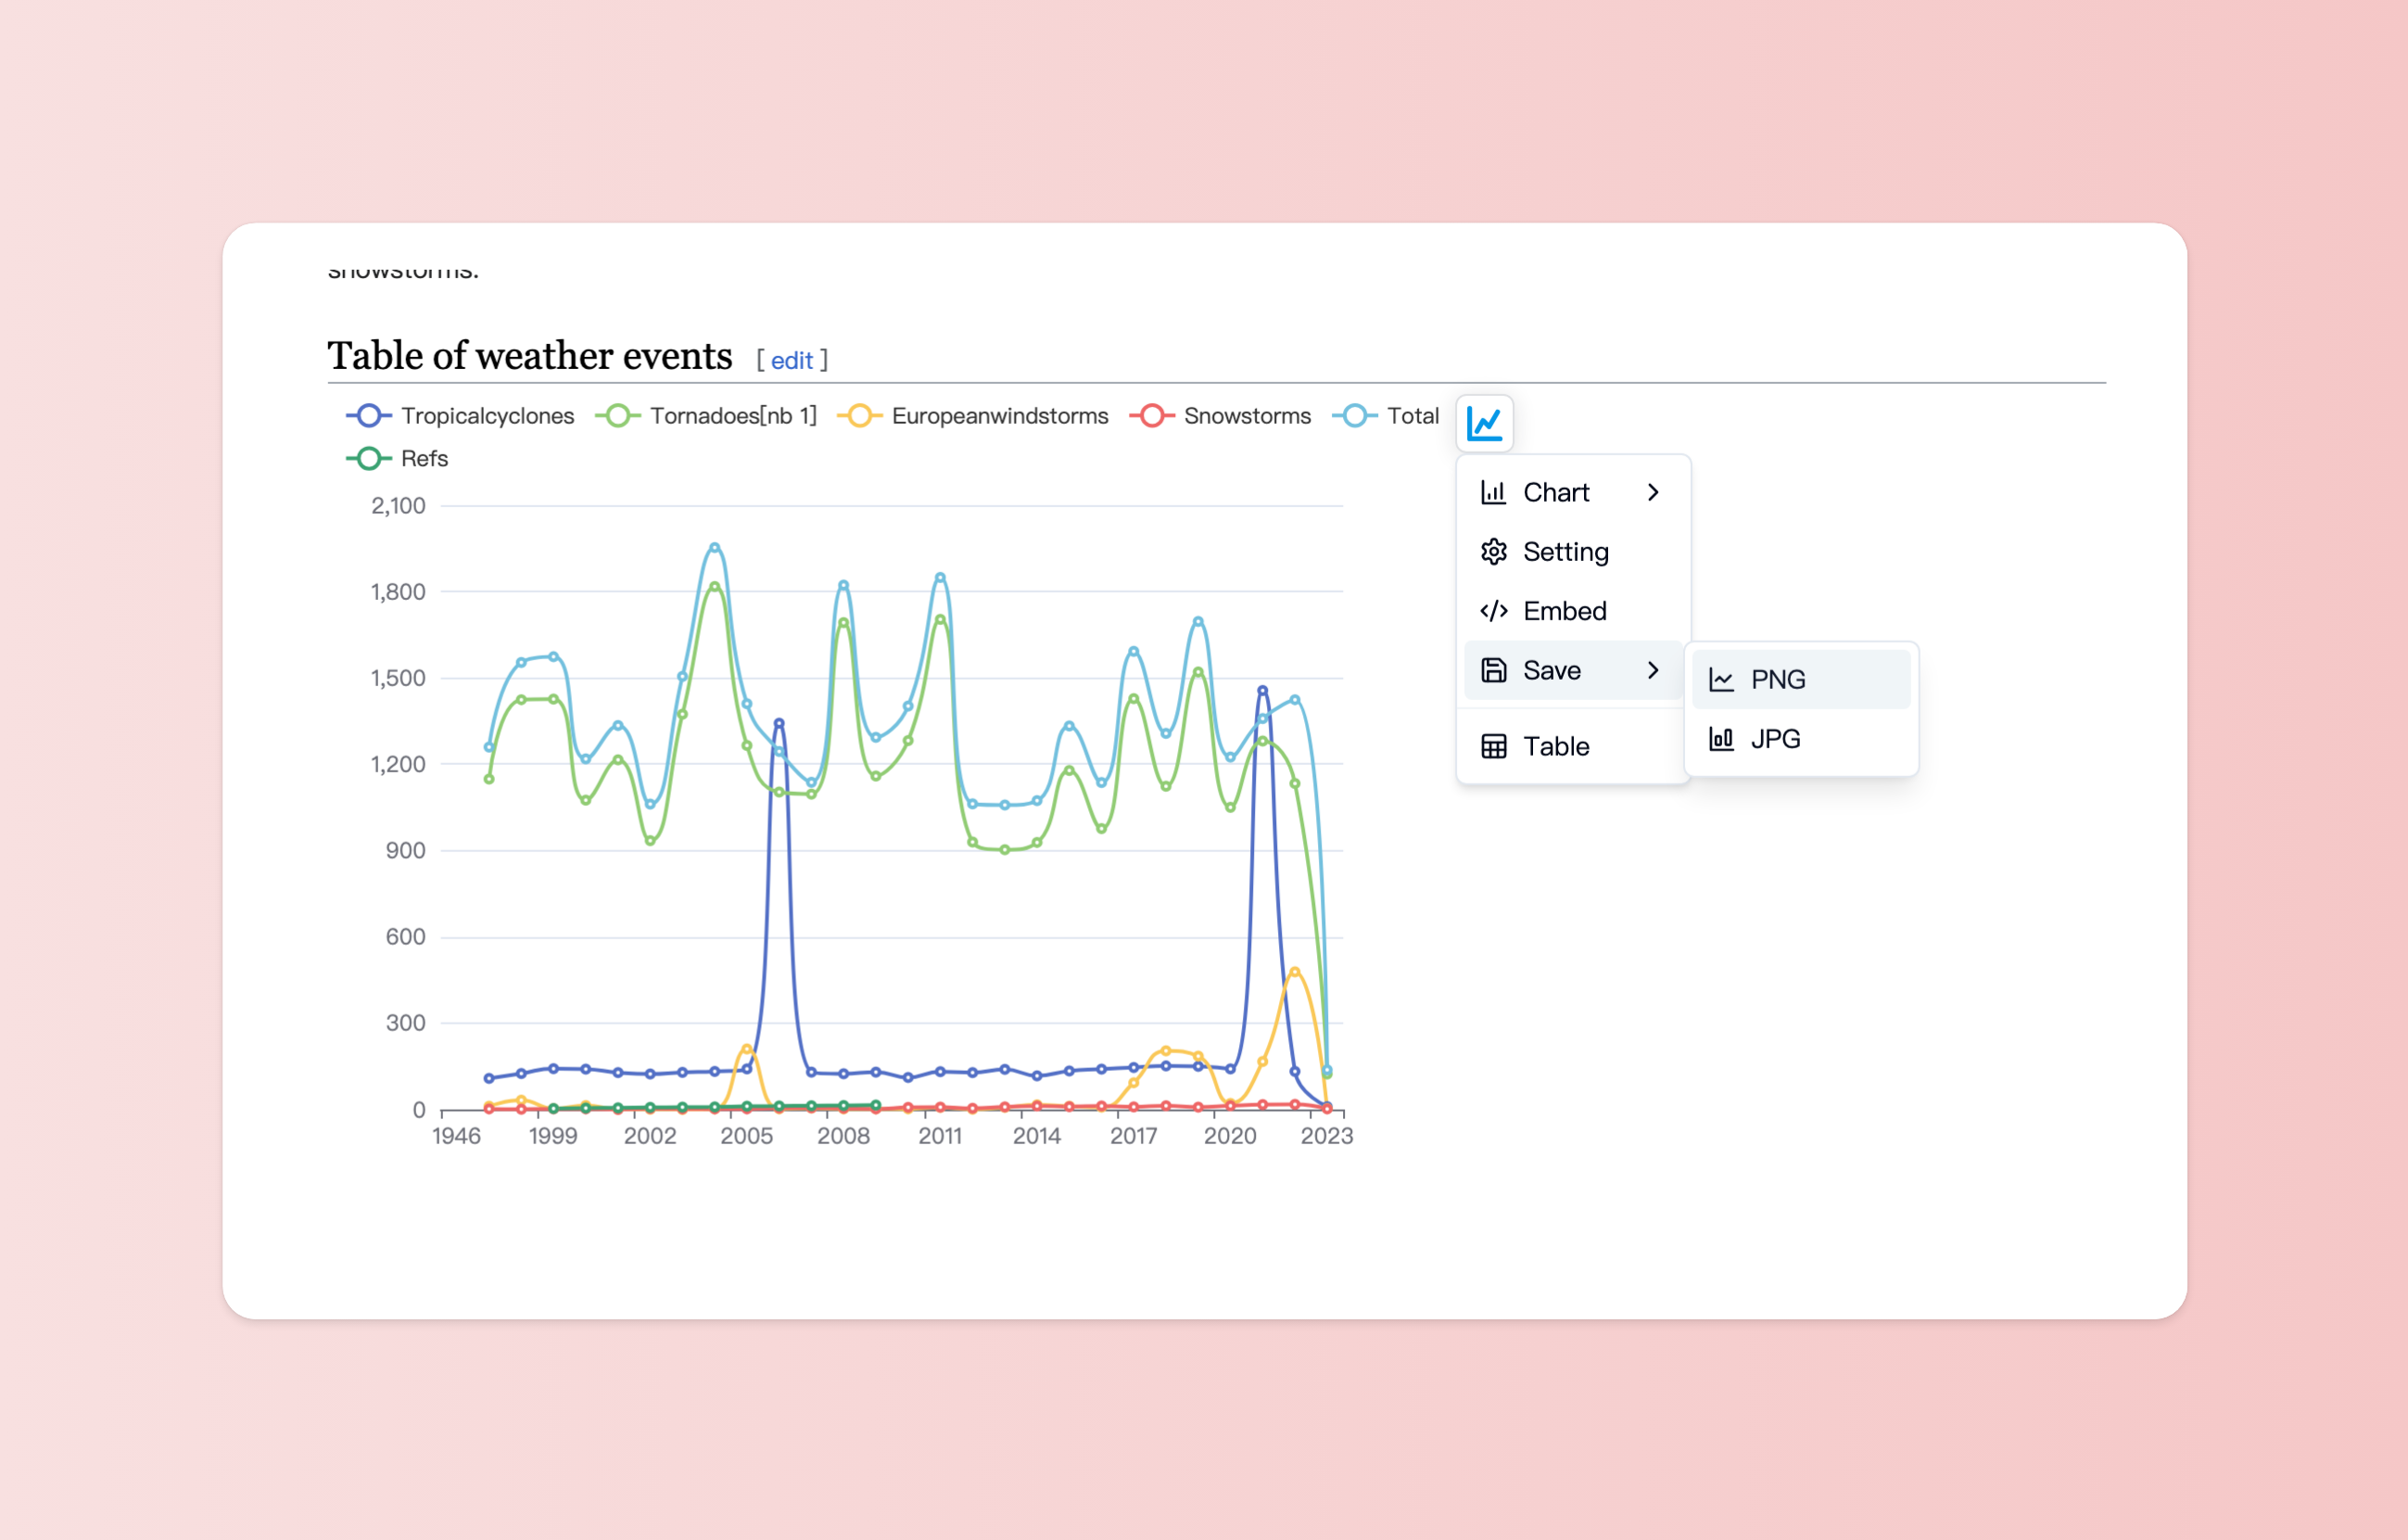
Save and Download
Pricing
Free Version
Get started with the essentials. The free version of ChartImmerse provides access to all default chart types.
$0
Get- Basic Line Chart Generate
- Basic Bar Chart Generate
- Basic Scatter Chart Generate
- All basic chart types in future updates
1 Year Pro Version License
Unlock the full potential of ChartImmerse with our pro version. Gain access to all chart types, advanced customization settings, and the ability to export charts as online links.
$14.9
Buy Now- Generate line chart, bar chart, scatter chart, and mixed charts.
- Customize chart settings flexibly.
- Generate shareable chart links.(iframe / direct link)
- Save as PNG or JPG images.
- Access to all future updates with new chart types and features.
- 7-day refund guarantee
Frequently asked questions
- How does ChartImmerse work?
ChartImmerse is a Chrome extension that seamlessly converts HTML tables into interactive charts. Simply install the extension, navigate to a webpage with a table, and with a few clicks, your table will be transformed into a visually appealing and interactive chart.
- Which chart types are supported?
ChartImmerse currently supports line graphs, bar charts, scatter plots, and mixed charts combining different types. We are continuously working on expanding the range of supported chart types to cater to your diverse data visualization needs.
- Can I customize the charts?
Absolutely! ChartImmerse provides a rich set of customization options. You can modify chart titles, axis labels, data formatting, and more. We are committed to adding even more customization settings to empower you with complete control over your charts.
- How can I share the generated charts?
With ChartImmerse, you can easily export charts as online links, allowing you to share them across various platforms. Additionally, you can use iframes to embed the charts on your preferred websites.
- Can I save the charts as images?
Yes, ChartImmerse allows you to save your charts as PNG or JPG images. This feature enables you to use the charts in presentations, reports, or any other medium you choose.
- I need XYZ feature, can you add it?
Hopefully yes, we always listen to our users' demand, but we can't guarantee how soon we can implement it, you may refer to our roadmap page, and submit a feature request if the feature you want is not listed.